SuiteAnalytics Workbook Step by Step
Building NetSuite SuiteAnalytics Workbooks from datasets to pivots and charts, for when saved searches hit their limit.
About this episode
Rachel Sors, a Luxent managed services consultant, gives the session its frame with one rule of thumb: reports are for official numbers, saved searches are for finding things, and workbooks are for understanding trends.
She lays out the two-part structure, a reusable dataset as the data source and the workbook as the interactive analysis layer built on top of it.
The rest of the hour is a live build in a demo account. Starting from out-of-the-box templates rather than a blank page, she drags department and location fields into a dataset, filters to invoices, builds pivots and charts, and writes formulas against the built-in validator. The most practical example links two datasets, fulfillments and billed orders, to surface shipments that were fulfilled but never invoiced. Q&A covers converting saved searches (no one-click path, treat them as blueprints) and where workbooks sit alongside Tableau and Power BI.
Talk to a NetSuite consultant
Questions about what you just watched? A 30-minute call with our team gets you straight answers on your own setup.
Book a call00:05Hello everyone and welcome and thank you so much for joining us today for this Lux University session on speed analytics workbook. Again, we're talking about NetSuite SuiteAnalytics workbook. So specifically how you can kind of move beyond the limitations that you run into with safe searches and start working with a little bit more of a flexible analysis ready kind of reporting here. So, my name is Brooke Gyepes and I am joined by Rachel Sors, one of our managed services consultant here at Luxent.
00:31And Rachel works hands-on with our our customer base and reporting, analy analysis, analytics, and she's excited to walk through SuiteAnalytics workflows with us today. That is a mouthful. Okay, so just a quick agenda kind of cover of what we're going to be doing today. Today I'm going to do a quick introduction um to Rachel, give you some um idea of what we have coming up on our Lux University sessions. Um and then we'll jump right into Rachel kind of talking through what SuiteAnalytics workbook is, how you can use it, and then into a live demo.
01:07And then of course at the end we'll have our our Q&A session. So, if you do have questions as we are walking through the demo, since this is something that you know, if you have a question about a particular topic within the SuiteAnalytics workbook that Rachel is talking about, feel free to put your question in the Q&A panel at the bottom of the screen and we'll do our best to answer them kind of live as she's walking through just so um that we can answer it kind of in the moment there. All right.
01:30Well, let's get started with some introductions. So, I just wanted to quickly take a moment to properly introduce Rachel. So Rachel Sors is one of our managed services consultants here at Luxent. And she really brings a strong mix of functional and financial experience to the team. So she's worked across a variety of industries including nonprofit, technology, media, telecommunications, and many, many more. Um, and different roles kind of spanning like functional consulting, financial analysis, and sales operations.
01:58So within NetSuite, Rachel specializes in financial reporting, advanced accounting, and integrations. So she's very familiar with the kinds of reporting challenges that we see when teams start to kind of outgrow standard reports or save searches. So that's why she's kind of our expert here in SuiteAnalytics workbooks. Rachel also holds multiple NetSuite certific certifications including BI and save searches which is especially important to everyone on the call today as she's talking through SuiteAnalytics workbooks.
02:28Um she has her administrator certification, SuiteFoundation and net cache. So lots of experience there. And then outside of work, Rachel en enjoys gardening, boating, and birding. And you can see on the screen there are her two pet birds, Barney and Patty, who are very cute. So, we're excited to have Rachel here today on the call with us to walk through SuiteAnalytics Workbooks. One last note before I kind of pass it over to Rachel to get to the good stuff. I wanted to quickly share a little bit, as I always do, about the goal of Lux University.
02:59So Lux University is really all all about helping you and your teams feel confident and empowered in NetSuite. So whether you're a new user or someone kind of looking to take your expert expertise to the next level, these sessions are really designed for you and built around real use cases. So we we kind of take different things that we see um through our Lux service program and see a lot of cases that might be kind of coming up over and over and try and build sessions around what some of those topics might be.
03:27So, just to give you a preview of what's coming up, in May we'll be covering custom KPIs and dashboards. In June, we'll do NetSuite Bank reconciliation. And then in July, we're going to be tackling kind of MRP. So, I know we did a session that kind of hinted at that a handful of months ago, but this is going to be a full MRP session. So, as always, we want this program to kind of grow with you. So, if there's a topic that you'd like to see covered in a future training session, please put it in the chat or share it with us in the survey that's following this session.
03:58All right, Rachel, I'm going to pass it over to you. >> Thanks, Brick, for the introductions. All right, now that we've set the groundwork, we're going to shift into getting started with SuiteAnalytics workbooks. I'll start with the basics and then we'll build from there and jump into a live demo. So, let's start with the big picture. What is SuiteAnalytics Workbooks? So this is a NetSuite built-in tool for advanced reporting and analysis. It's specifically designed to go beyond the limitations many teams hit with standard reports and save searches, especially as data becomes larger and more complex.
04:47This SuiteAnalytics workbook is a great tool for that. Uh with workbooks you can work with larger data sets, pull data across multiple record types and analyze it using tables, pivot views and charts all in one place. And this allows for much more multi-dimensional analysis, meaning you can slice, you can filter all the same data in different ways without building a new report every time. And what's powerful here is that you can answer many questions using the same data set without, you know, having to create multiple reports or searches.
05:32And whether you're looking at, you know, performance over time or comparing dimensions like department or product or exploring outliers, this tool helps you do that all in one place. It also helps um without you know having to export Excel and creating multiple versions and pivots of that Excel or building multiple searches. So you can think of SuiteAnalytics workbook as your analysis layer in NetSuite. It's flexible, interactive and built for decision making rather than static reporting.
06:18Okay. So, how does it work? So, it's two parts. Um, so you start with building a data set and that's your foundation of your analysis. You can think of the data set as a collection of data, tables, fields, and relationships where you prepare before you build the report. um you're pulling data from NetSuite records like transactions, customers and items and the data set acts as a reusable data source.
06:53So um it can be recycled and repurposed in multiple ways once you get to the workbook. And the workbook is where you're analyzing and visualizing that data set. Um you can think of that as your interactive report or dashboard built on top of a data set. Okay. So choosing the right tool. So NetSuite has three main ways to get your data. Reports which are structured. They have a financial style reporting and sometimes they're harder to customize but they're easy to run and they're financially accurate.
07:37You can also use save searches. They're flexible uh for operational queries. You get static output, limited visualization, and they can get complex. They're best for lists, automation triggers like emails and scheduled emails and alerts and day-to-day operations. And SuiteAnalytics is an interactive data analysis and visual visualization layer. You can use drag and drop inter interface which we'll show in the next demo.
08:13And you can have multiple views and you can create trends and data exploration through using workbooks. You can't use them for workflows or alerts and it does require some setup. So I like to think of it as reports are for official numbers, save searches are for finding things and workbooks are for understanding trends and making decisions. Okay.
08:49So why SuiteAnalytics workbooks? So workbooks let you explore your data in real time to answer new questions without rebuilding reports or leaving NetSuite, you know, exporting to Excel. Um, and workbooks. This is not going to replace your reports, but they can eliminate the need for rebuilding reports. Uh the workbooks also solves that you can separate the data from analysis and you can create a data set once and then explore and use it in multiple ways with charts, pivot tables in different views all in real time.
09:38For example, if you want to look at revenue by region and then switch to looking at it to product category or filtering a specific time period or adding calculated metrics for margin percentage, you can all you can do that all in one workbook. Okay, so key use cases. So now that we've talked about why teams are using SuiteAnalytics workbooks, here's some of the most common ways we see them used in practice. So starting with finance, this is where workbooks really shine for analysis.
10:14You can use them for things like revenue analysis, budget versus actual comparison, and gaining better visibility into revenue recognition. You can also analyze your P&L by department, class, or location. And it can even support more complex needs like intercomp reconciliations. You can do this all without maintaining dozens of safe searches or reports. On the operation side, they're great for understanding end-to-end processes.
10:52uh for example tracking the life cycle from order to fulfillment to invoice and identifying delays or bottlenecks in that process. You can also use it for analyzing product performance and margin. And we also see customers use it for warehouse efficiency, return trends and quality analysis. And in these areas you can pivot and slice the data quickly with you know without making multiple reports and searches. And finally for admin and IT teams analytics workbooks help connect data across record types that don't naturally come together in standard reports and searches.
11:39This supports complex reporting needs, user activity monitoring, and data quality checks, and even audit and change tracking, all from a single unified data set. The common theme across all these cases is flexibility. Workbooks let different teams ask different questions of the same data without rebuilding reports every time. So that makes them such a powerful analysis tool across the organization. Okay, so we've covered the key use cases. We're going to jump into a live demo and take a look at what SuiteAnalytics workbook actually looks like inside NetSuite.
12:25During the demo, I'll show you how to navigate workbooks, review an out of the box example, and build a simple data set so you can see how this works end to end. Okay. So, I'll go ahead and share my screen. So, from here in NetSuite, I'm working in a demo environment. It may be a little slow, but so to navigate to analytics, there's a tab here called analytics, and that's where this functionality lives. If you do not see this tab, you'll need to enable it within enable features and it's found within the analytics tab and it's SuiteAnalytics workbook.
13:11Okay. So, I would imagine most of your environments have it turned on, but that's how you would enable it. So, from the analytics tab, um there are two tabs, workbooks and data sets. And within both tabs, there are multiple out of the box templates that I highly encourage you to take advantage of if you're just starting out, you know, learning workbooks and data sets. Um, so I I believe there's about 20 out of the box templates. Uh, there may be more based on, you know, different features that are enabled in your environment.
13:52So, we we'll look over some of those out of the box templates. And I'm going to start on the workbooks tab and we'll look over two out of the box templates. Okay. So, sales overview, this is one we'll look at and we'll also look at transaction detail. So, we'll start here. So from this workbook you can just click on it. You can see it says template. All right.
14:28So this is bringing you to the workbook and uh like I said this is out of the box. You can revise this and make it your own but it's a good way to start to get familiar with the solution. So, it's bringing us to the transaction detail and there's three tabs here that looks at different different analysis of transaction detail. So, when we get in here, we can see it looks pretty much just like a table. And then we have a pivot that's looking at the transactions overview.
15:05And looking at this, it looks like it's taking all the transaction types and counting how many are in the in this criteria. And then we have account over turnover. So it's looking at the transaction accounts by subsidiary um and the sum of the amount. Okay, so this is good. It's some good analysis, but let's dig into the data set that's associated to the workbook. So to get to the data set, we're going to click on the three dots here where it says transaction detail.
15:44And that's going to bring us to the the data table. So we're going to open the data set. And this is if you're familiar with searches, this is where you can define your criteria. All your fields are on the left that are available to tap into. And in the middle is a description of those fields within each section. So it puts me on the transaction table when I'm here. If it's highlighted blue, I can I can tell that that's already in my results here in the middle.
16:21And by default, when you start to build one, it's going to put some of these fields automatically in there. All right. So this is looking at has some criteria already set up. The criteria is saying date is on or after start of the month transaction accounting align amount not consolidated is not empty and it's not looking for account types that are empty or non-posting. So if we wanted to, you know, add some more details to this for our workbook view, maybe we want to include, you know, department within.
17:04You can see I'm highlighted blue on transaction and scrolling down. I'm looking for department. So I'm not seeing it here. So we're going to look at the transaction line. So, similar to a search, you have header fields and line fields. Same thing in SuiteAnalytics. So, here's my department. And you just going to drag and drop it into your results. And again, this is a demo environment, so it may not have all the data populated, but so we have department.
17:40Let's look at pulling in location. So, again, drag and drop. All right. And um as you work through this uh more and more with this this feature, um it's always best to rename your your column headers because when you get to the the workbook, uh if you're using multiple join fields, uh it can be a little messy. So we can rename it and with a nice neat name here and you'll see more options here.
18:19You can sort the results ascending descending. Sometimes you also if you have too many results here you want to see where this location is in the field list. So I have department field but where is it coming from? Well, it's sourcing from the transaction line. So that's a helpful tool to tool uh especially as you go into the join fields. All right. Okay. So it's adding fields and you can see it's quite extensive on the left of what is capable of pulling in um created from.
19:02You can see, you know, maybe we're looking at invoices and we can put a filter on here. And so I might have done that quick, but uh so we want to tell it we only want to look at invoices. So we'll drop type into the criteria header and select invoice. Okay, invoice. And then it's going to refresh its results. And so if we want to also pull in what the invoice was created from, we can go and tap into those fields on the left.
19:43And there's a little arrow that also expands quite further on what you can tap into. So um we can go to maybe document number and that would pull in the sales order number. or transaction number. And we'll just give it a minute to load here. Okay. So, there's going to be validations, but let's just get this into our workbook and see what it looks like.
20:23So, uh we can apply to workbook. I would recommend saving it, but we're just repurposing an existing workbook and data set here, so I'm not going to save. All right. So, we can from here pull up the tab that you can create a new table, pivot, or chart. So, I'm going to create a pivot. And now this is where you're going to drag and drop and how you want it to look.
20:58So we maybe want to look at we have department and it's trial and error. So feel free to move things around as you know what you want to look at and what your expectations are. And when working with the workbook, you always want to refresh. It's not going to it's not going to display anything until you do. All right. So, we can see that here's our departments and our sub the amount of invoicing uh that we had for the engineering department in this subsidiary during our um filter for date.
21:45And you can also if you want to add more details you just drag and drop and then refresh. And you can also sort filter on this field further. So it it by default set it to year. So let's put it to month. Do a refresh. So you can see you know in month four here's the invoicing we had under our US West subsidiary. Okay.
22:23So maybe you know you want to look at it a different way. You can again create a add a plus add a table or a chart. A table um is pretty much uh all the results. So you can click add all fields to the table and it's going to add all those results in a table form. Okay. So that's that's one way um and you know getting started uh if you haven't used it before try to use an out of the box um workbook and scale it back for what you're looking for.
23:00and you know don't be shy in throwing you know results here and testing them out. Uh the other um workbook that I wanted to look at was the sales overview. This is another out of the box template and you can see this, you know, has six um charts and templates already set up here.
23:34So, we have the table and then we have sales by item. I got an error, but that's okay. Um maybe some of the data here in the data set sales by customer. So and you can collapse these fields just to get them out of the way so you can look at your pivot. So this one uh we can see it's looking at customer sales rep and invoices by year and quarter.
24:12And again, if something, you know, isn't up to what you're looking for, you can simply filter it out or, you know, maybe you don't need customer or you can customize it by adding fields to your rows and columns and measures. So measures um is, you know, maybe you want to look at margins or, you know, do a calculation. It's quite simple at this point. um when you're on the workbook, it's not complex formulas, but you can do um some average, count, min, max.
24:47You can also um sort by this column. You can create your own. So maybe you want to do a simple calculation for uh amount. I'm just doing something on the fly here. minus you know if you had another amount failed and then give it a name. At this stage um it's quite it's similar um functionality to a report you can do you know standard subtraction uh addition if you need to create more advanced formulas you would do that on your data set.
25:35Okay. So, let's go back to the data set. Um, so on this data set, you can see that right at the top of your fields is formulas. And it's quite cool the way this works. Um, it does a validation for you before you can even save it. So you may not know much about formulas but it again similar to searches. Uh you can pick the function here from the list. If you double click it, it will give you a little example of how you should set it up and what this function does.
26:19Uh when you double click it, it also puts it up here. So maybe you want the absolute value of a particular field. I'm just going to doubleclick here on fields. These are all your source fields that you can use in this in this formula. And it does not have to be in your results. You can scroll down and see that it's extensive. You can tap into all the fields on the left that you can use in the data set, but I'll use one that's in the results cuz Okay. So, we have it prepared.
27:05We need to give the formula field the name. All right. And I'm going to press this validate button. So, it's going to tell you, does it like how you set it up? Is it set up properly? And it doesn't like it. Um, so I may have not picked the best uh field for um that, but let's try putting it as float. So you can see it's intuitive and it's going to tell you um recommendations for um the argument that you put in and it doesn't like it.
27:44Um so let's try another field, but it's it's super super helpful. Okay, it like that one. So you can see it provided a green checkbox. So it likes that. So we'll save. And now you just created a formula. You can drag that field into your results, which will then carry over to your workbook. In your workbook, you can use that field. You can see it here on the left. and use it as one of your layout columns or rows or calculated measure.
28:27Okay, so those are uh some tips in using the out of the box options. I also built some other workbooks and data sets to show you some capabilities with this SuiteAnalytics. So, one thing that's really cool is you can link multiple data sets. So, in this in this workbook, I'm looking at fulfilled versus build orders.
29:02So this will showcase um some partial billing gaps. So I created a data set on fulfillments and build orders and then I linked them because they have a relationship um and then built out this work this workbook to show where maybe we need to invoice. We already uh produced the item fulfillment but we need to create the invoice. So let's just take a look at how that that's done. So I'm going to look at the fulfillments data set.
29:42And you can see here's my criteria defining, you know, the transaction type. I filtered out some items um in this demo environment. They weren't working well. Um tax line, I didn't want to show that. and then didn't want to see any sales orders that were build, cancelled, or closed. I'll just collapse that so you can see, you know, just pulling in what was what this item fulfillment was created from. So that source is sales orders. That's your relationship in both data sets, the invoices and the item fulfillments.
30:20So that's going to be your link to link both data sets into the workbook. I have the item fulfillment item fulfillment number and I was just playing around with the absolute value and quantity. Okay. So see did I create yeah I had created some formulas to set absolute value on quantity. All right so I didn't make any changes here. So I'm just going to cancel and it will bring me back to my workbook. So then I had created a build orders data set and similar criteria defining the transaction type and then making sure to pull in the created from that sales order that relationship and then creating a data set link.
31:18So here it is and NetSuite's going to um only allow you to link the relationships. So customer that's the same on both transactions created from that's your sales order in item fulfillment number and inventory number. So that necessarily isn't needed, but those two top um fields are your relationship. and you would just drag fields. So, I'm just pulling in two different fields, but you can see it's linking them.
31:59But the true relationship is the sales order and the customer. Once those are linked, then I built this workbook and um you know, you can filter it, you can sort it on your column headers, similar to Excel, right? So ascending descending and you can highlight I highlighted any of the difference. So my calculated measure I subtracted item fulfillment quantity and inventory quantity sorry invoice quantity and just highlighting those differences uh to call out you know where we need to bill.
32:44So in my calculated measure, I'll just show you that you can see simple item quantity minus inventory quantity. All right. And let's see what else. So we went through formulas and then highlighting and I didn't showcase this. So with workbooks you can export it. Um you can export into Excel or CSV. CSV pretty standard.
33:26Um, you can display subtotals and grand totals a little different setup, but you just define what you're looking to total. You can highlight rows, highlight columns. You can freeze row headers as you can in Excel. Sometimes uh your workbooks get rather large.
34:09You can display the pivot in a compact mode. So there's some options here. You can export it to SDF for websites. You can also share workbooks. So it's always recommended to share it from the workbook rather than the data set. So the the next user will see the link. So here's the share button. Similar to searches and reports, you can share it to individual roles externally. employees.
34:46Maybe you just want to share it with one employee or maybe you just want to select all or share with all. And you know, always make sure you're saving. Okay. You can name it here at the top in this little eye icon. Click on that and that's where you give it a name. So that's one workbook that I built and um let's go back to analytics tab.
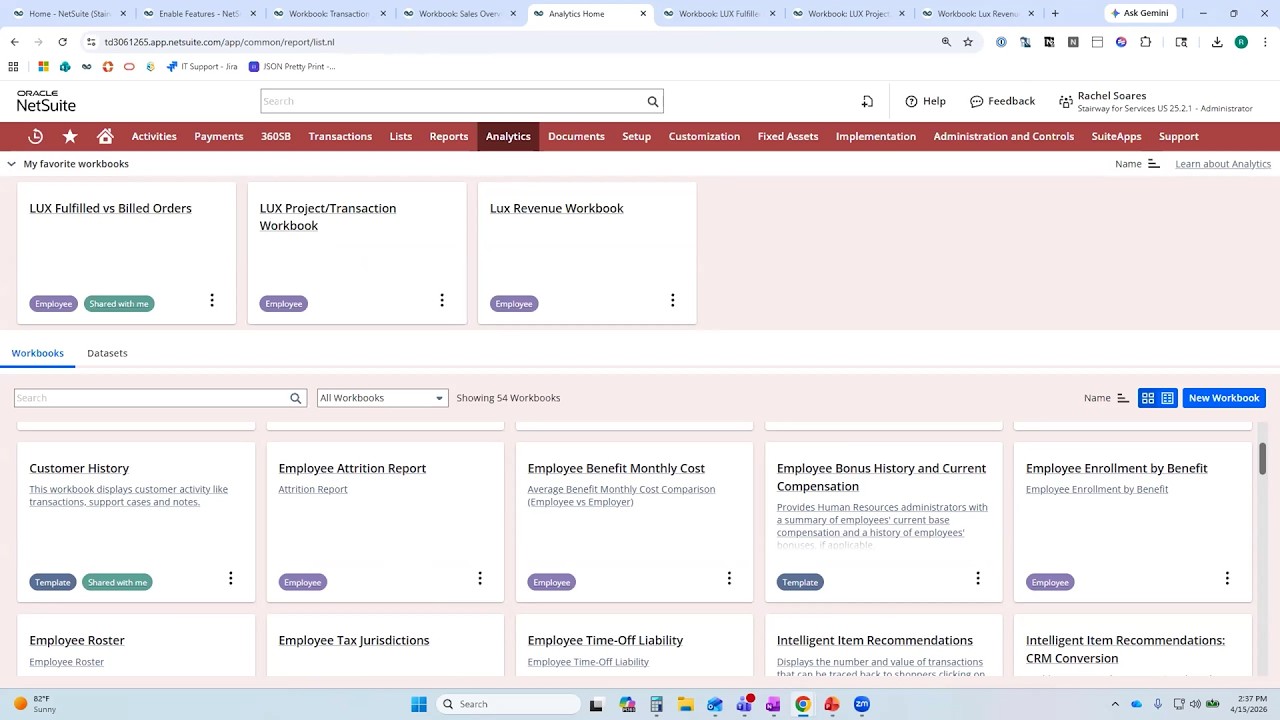
35:27So you can favorite your workbooks as well so you can quickly just get to them. And that's what I did here with the three that I created. So when you're before to create a favorite, you just come to the three dots and then mark as favorite and that will put it up here in your favorite workbooks. Uh another thing, SuiteAnalytics workbooks, it's going to carry over the permissions from the role that the user is using just like it does with reports and searches.
36:06So if if a user cannot view invoices then you know if they ran this this workbook they're not going to be able to see the data. So it does carry along the permissions of your role. There are permissions um that you can set up to set a user as uh SuiteAnalytics admin so they can see all everyone's workbooks and data sets. So can keep that in mind. Okay.
36:48And on the data sets tab you just see you know all the options available. So when you click on new data set on the right there are hundreds of record types that you can tap into just as in searches right so if you go and create a new search there's you know numerous search types that you can start with. Same thing with data sets. Um, typically I would start with transaction. That's the most popular, but it's very expansive. So, transaction is the most popular one that I'm working with.
37:35Okay. What else are we going to go through? Oh, revenue by customer. Okay. I wanted to showcase that one as well. Okay, so I created another workbook just to demo and showcase um revenue recognition um is sometimes challenging with searches because of the join fields and how far away they are. Um with analytics it can make it a little easier to get them all linked together. This is a simple one I just threw together. Um, let's look at the data set that it's associated to.
38:16So, looking at invoices, mainline is true. Didn't want to look at anything that was voided. And this environment had um multicurrency transactions. So, just to keep it clean, I'm looking at US dollar transactions. What do I have in my results? So, location, sub, customer, hosting period. I created um a formula for profit margin, simple formula here and put that formula in my results.
39:00And I was just playing around just to see what it will look like. and then want to see what it looks like on my workbook. Okay, so this is showing all my customers and I'm filtering by the year of 2025. Customers revenue by year and month. So, it's pretty big. Maybe I need to refine this a little bit and I want to filter it out. and maybe I want to see, you know, the top 10 customers.
39:42So, it's really simple. So, I just went to my calculated measure down here and filter by customer top 10. Press apply. Refresh. And now I only have 10 results. And that's showcasing top 10. It's telling you right in your filters. Here's your filters applied. I can also utilize this as um a dashboard view. which I added to my dashboard here. And you can find that under analytics and when you're personalizing your dashboard.
40:30Okay. And what else did I do with this one? Okay. I made a chart. So with the same data set, you can create chart just by pressing the plus sign, click chart and set it up. And I just did monthly revenue by sub. So we can see the revenue by each month for each of our subs. You can create many different types of charts.
41:06Here's, you know, some of the options available. You can make it look pretty with titles, subtitles, and XYaxis labels. You can print your charts, export to CVG, can also create a pivot from the chart. All right. Finally, I created another workbook on project and transactions.
41:46Again, I linked data sets here, but um after doing so, I realized I didn't necessarily need to and could just compile it all in one data set. But um let's take a look at what I set up here. So I was looking at um projects and plan versus recognize revenue. So I pulled in the project name pulled in revenue fields for plan recognize and then did a comparison of difference and this would just call out like okay so let's take a peek if I have any differences.
42:31All right. So, on this project, it looks like we have this much planned and this much recognized. So, it's off by 4,000. So, maybe it's just timing. Uh, it's not ready to be recognized. Or maybe I need to go and run revenue for that. So, that's one pivot. Another is um looking at project invoices by customer. So just looking at customer and each project and the associated invoices and their total amounts.
43:11Then I created a chart. Uh let's see what this looks like. And it's a bar chart with projects and uh their invoice totals by customer. Okay. So I think That's everything I wanted to cover today. All right. So, just bringing this all together and what does this mean for your team? So, suite analytics will help you unlock more value when you're creating reports that can become quite complex in that suite and let you bring data in from multiple areas into one place and reduce your reliance on Excel and workarounds and allows you to explore trends in finance and operations without building multiple reports.
44:11So when standard reports and searches fall short, workbooks give you the flexibility and analysis ready way to understand what's happening in your business to make better decisions. With that, I I hope it's been beneficial and helpful to you in this demo. Awesome. Thanks so much, Rachel. Okay, we'll open it up now for um some question and answer here. Um, I've got one question. Can I convert my existing save searches into workbook data sets or do I have to rebuild them from scratch?
44:48>> Oh, that's a good question. Um, there isn't a one-click conversion. Um, but typically we'll use your save searches as a blueprint and then we enhance them in workbooks and pivots and charts. >> Okay, awesome. Uh, looks like we have a two other questions here. So, can workbooks pull data from custom records and custom fields or only standard record types? Yes. So, you can absolutely pull in custom records and custom fields.
45:26Um, when looking to join the data sets, the key is that there's that relationship connected, you know, just like a database. Okay, super helpful. All right, and finally, I'm sure this is one that many others also had this question, is can this tool replace tools like Tableau or PowerBI? >> That's a great question. So, NetSuite SuiteAnalytics, it it's not trying to be a full enterprise BI replacement, but it will really shine in giving you real-time access to transaction data without exporting it.
46:03And I know many customers will use this tool alongside, you know, the Tableau and PowerBI. >> Okay, awesome. All right, well that's all the questions we had for today. So, I'm just going to close us out here. Um, and again, thank you everyone for taking the time to join us today. And a big thank you to Rachel for walking us through SuiteAnalytics workbooks and sharing how teams can use this in kind of a more day-to-day process. So, if any questions do come up after the session um or you're kind of trying to think about how you could use this in your environment or looking for some more kind of one onone help, feel free to reach out.
46:44We're always happy to talk this through. So, before you hop off, there will be a quick survey as always at the end of the session. We really appreciate the feedback that you provide in those surveys and it it helps us shape the future sessions there. So, thank you again for joining us and we hope to see you guys next time. Have a great day. >> Thank you.